Markets
Is DexCom (DXCM) A Super Performer?

Is DexCom (DXCM) A Super Performer? DexCom Inc, [NASDAQ: DXCM] has had many quarters of super performance in my opinion. Back when DXCM was trading around $370 we featured it on “The Chartist Column”and it then made a massive move to around $450.
In this Article we will go over some notes on:
- Earnings
- Stock Chart Commentary
- Technical Analysis

First, lets talk about the Chart of DXCM, which you can find above this text. In my opinion the MACD on the Daily Chart followed by the price action show that around July 13th the Stock has been consolidating. This consolidation is healthy in my opinion as it really gives the stock times to set up again. The key areas I am watching are around $440 as I would love to see supportive volume to come in to the upside as it increases over $440.
EARNINGS
Now, let’s talk about the companies recent report of earnings.

Credit: Market Smith
This company has reported explosive % increases in its earnings per share category for multiple years as far as 2018. Not to mention the companies sales has been increasing as well.
A few notes from its latest earnings report.
- Beat sales estimates by around 11%
- Beat EPS estimates by around 154%
- HUGE Breakout in annual EPS from 2019 compared to 2019
- They are seeing “Rising Volume across all channels
- Strong new patient additions
DexCom is finally producing products for clinical trials regarding it 1st G7 device, which is the companies latest glucose monitoring sensor. They continue to enhance the current G6 device though.
Early in the year at the peak of the pandemic, many companies decided to withdraw from there Annual guidance. DXCM announced that they are reinstating its full year 2020 guidance.
REGIONS OF SUCCESS
United States makes up around 81% of its revenue. The revenue that was mad in the United States increased by 37%. As far as international revenue, that increased by around 20%. Two of the fastest growing market though, are, United Kingdom and Canada.
TAX BENEFITS
On a conference call DXCM stated they are able to ” utilize significant historic tax benefits that will allow them to “continue to expand rapidly and efficiently on a global basis”
DXCM remains a solid company in my opinion and they expect ” 25 % ” year/year revenue growth. One last thing to mention was DXCM was able to double the capacity of G6 in the 1st half of the year.
Is DexCom (DXCM) A Super Performer? In our opinion, it has been but that doesn’t imply that it will continue to have super performance.
Trader? Make sure to check out our FREE Powerhouse Report exclusively on Lusso’s Business.


DO NOT MISS THIS FREE OPPORTUNITY!
ARE YOU A TRADER?
DO YOU WANT FREE STOCK PICKS?
CHECK THIS OUT….
Ready to elevate your trading game with the next big winner? Don’t miss out – join the savvy investors who are already benefiting from our Wall St veteran’s free SMS alerts. Act now! Sign up at https://slktxt.io/ZmRx or send ‘FREE’ to 844-722-9743 and be the first to get the insider scoop on what’s hot in the market
MGO Global Inc. (NASDAQ: MGOL) Surges 446% on Strong First Quarter Earnings
MIAMI, FL and LONDON, UK and NEW YORK, NY / ACCESSWIRE / May 21, 2024 – MGO Global Inc. (NASDAQ: MGOL), a digitally-native lifestyle brand portfolio company, saw its stock skyrocket by over 446% following the announcement of its financial results for the first quarter ended March 31, 2024. The remarkable rise in share price is attributed to the company’s impressive revenue growth and strategic business moves.

First Quarter Financial and Operational Highlights:
- Revenue Growth: Total revenues for the quarter surged by 1385%, reaching $670,264 compared to $45,147 in the same period last year. This substantial increase is primarily due to the launch timing of the Company’s Stand Flagpole line of products, which began mid-March 2023.
- Strategic Agreement: On March 21, 2024, MGO assigned its Trademark License Agreement (TLA) with Leo Messi Management (LMM) to Centric Brand. The deal included $2,000,000 in cash and Centric Brands taking over all rights and obligations under the TLA, including a minimum guaranteed royalty amount of €1,500,000 due to LMM in 2024. Consequently, revenues from the Messi Brand products have been classified under discontinued operations for both the 2024 and 2023 periods.
- Net Income: MGO reported a net income from discontinued operations of $1,927,298, a significant turnaround from the net loss of $527,619 recorded in the previous year. This improvement is largely due to the Centric Brands deal. Overall, the company posted a net income of $63,163 for the quarter, compared to a net loss of $1,220,125 in the same period last year.
- Loss from Continuing Operations: The net loss from continuing operations increased by 169%, totaling $1,864,135, compared to $692,506 in the previous year. Despite this, the overall financial health of the company improved significantly due to the positive contributions from discontinued operations.
- Cash Position and Equity: As of March 31, 2024, MGO’s cash and cash equivalents stood at $1,517,158 with no long-term debt, and total stockholders’ equity was $2,042,886. This is an improvement from $836,446 in cash and equivalents, zero long-term debt, and $921,748 in total stockholders’ equity as of December 31, 2023.
- ATM Offering: In February 2024, MGO engaged Maxim Group, LLC to implement an At-The-Market offering (ATM) to raise up to $1,650,000 through sales of common stock. By the end of March, the company had raised net proceeds of $662,565 through this initiative.
CEO Commentary: Maximiliano Ojeda, Co-founder, Chairman, and CEO of MGO, expressed optimism about the company’s trajectory, stating, “MGO started 2024 strong, highlighted by material revenue growth for our Stand Flagpole business, coupled with the assignment of the Messi Brand to Centric Brands, which resulted in a $2 million cash infusion and the elimination of the 2024 minimum royalty payments to LMM of €1,500,000. MGO is now concentrating on driving sustainable, long-term growth of Stand Flagpoles, while achieving material efficiencies in our day-to-day operations. Moreover, in the first quarter, we took aggressive actions to simplify our cost structure, reduce our headcount and implement a more sustainable business model – all of which we believe will help position MGO to achieve positive cash flow in the quarters ahead.”
Conclusion: MGO Global Inc. (MGOL) delivered a standout performance in the first quarter of 2024, leading to a dramatic rise in its stock price. The company’s strategic maneuvers and substantial revenue growth have positioned it for future success. Investors will be keenly watching MGO’s progress as it continues to focus on sustainable growth and operational efficiency.

DO NOT MISS THIS FREE OPPORTUNITY!
ARE YOU A TRADER?
DO YOU WANT FREE STOCK PICKS?
CHECK THIS OUT….
Ready to elevate your trading game with the next big winner? Don’t miss out – join the savvy investors who are already benefiting from our Wall St veteran’s free SMS alerts. Act now! Sign up at https://slktxt.io/ZmRx or send ‘FREE’ to 844-722-9743 and be the first to get the insider scoop on what’s hot in the market
Greenwave Technology Solutions (NASDAQ: GWAV), a company specializing in metal recycling, saw its stock price plummet by 62% on Tuesday following the announcement of a significant share offering. This steep decline reflects investor concerns over the dilution of existing shares and the potential impact on the company’s future.

Details of the Offering: Greenwave Technology Solutions is issuing 420,596,154 shares at $0.052 each to institutional and accredited investors, aiming to raise $21.87 million in gross proceeds. Additionally, the offering includes warrants to purchase an equal number of shares at an exercise price of $0.10 each.
Impact on GWAV Stock: The offering price of $0.052 per share is significantly below the previous closing price of $0.16, which has alarmed investors and led to a massive sell-off. The dilution effect and the discounted pricing have significantly impacted the stock’s value, contributing to the 62% drop observed at market close.
Key Concerns:
- Dilution of Shares:
- The new share issuance greatly dilutes the holdings of existing shareholders, reducing the value of their stakes in the company.
- Discounted Offering Price:
- The offering price of $0.052 per share is considerably lower than the previous close, which has raised questions about the company’s valuation and financial health.
- Potential Delisting:
- GWAV stock is also facing the threat of delisting, as the company needs to adjust its share price to meet listing requirements. This adds another layer of uncertainty for investors.
Market Reaction: The announcement led to a drastic drop in GWAV’s stock price, with a decrease of 60.4% by Tuesday morning and a total drop of 62% by the end of the trading day. Year-to-date, the stock has declined by 73.7%, highlighting the ongoing struggles and challenges faced by the company.
What This Means for Investors: The substantial drop in share price due to the offering has significantly eroded investor confidence. The dilution and the potential for further financial challenges cast a shadow over Greenwave Technology Solutions’ future prospects. Investors need to consider the risks associated with the dilution and the ongoing threat of delisting.
Outlook and Strategy:
- Bearish Scenario: Given the significant dilution and the discounted offering price, the bearish outlook dominates. Investors should remain cautious and watch for any further announcements from the company that might impact the stock’s performance.
- Bullish Scenario: For any bullish sentiment to return, Greenwave Technology Solutions will need to demonstrate a clear path to recovery, potentially through successful utilization of the raised capital and meeting listing requirements to avoid delisting.
Conclusion: Greenwave Technology Solutions (NASDAQ: GWAV) faces a challenging road ahead after the significant share offering and the resultant stock price decline. Investors should stay informed about the company’s strategic moves and financial health before making any investment decisions. As always, managing risk with appropriate stop-loss levels and careful position sizing is essential in such volatile conditions.

DO NOT MISS THIS FREE OPPORTUNITY!
ARE YOU A TRADER?
DO YOU WANT FREE STOCK PICKS?
CHECK THIS OUT….
Ready to elevate your trading game with the next big winner? Don’t miss out – join the savvy investors who are already benefiting from our Wall St veteran’s free SMS alerts. Act now! Sign up at https://slktxt.io/ZmRx or send ‘FREE’ to 844-722-9743 and be the first to get the insider scoop on what’s hot in the market
Tupperware Brands Corporation (TUP) is a consumer cyclical company in the packaging and containers sector. As of May 21, 2024, the stock is trading at $2.08, showing a positive change of $0.08 (+4.00%).

Chart Analysis:
- Price Trend and Volume:
- The stock experienced a significant downtrend from August 2023, with a steep decline in price accompanied by high trading volumes.
- A period of consolidation is observed from November 2023 to April 2024, where the stock traded mostly sideways between $1.00 and $2.00.
- Recently, there has been a breakout from this consolidation phase, with the price rising sharply in May 2024, accompanied by increased trading volumes.
- Support and Resistance Levels:
- Support Level: The key support level can be identified around $1.00, where the stock found a base during its consolidation phase.
- Resistance Levels: The stock faces immediate resistance around $2.50, a level that it approached but failed to breach in recent trading sessions. Another resistance level is observed around $3.50, marking a previous peak in September 2023.
- Moving Averages:
- SMA 10 (Short-term): The stock is currently trading above its 10-day simple moving average (SMA), indicating short-term bullish momentum.
- SMA 50 (Intermediate-term): The stock is also trading above the 50-day SMA, reinforcing the bullish trend.
- SMA 200 (Long-term): The stock is approaching its 200-day SMA, which could act as a significant resistance level. A break above this level could signal a longer-term trend reversal.
- Volume Analysis:
- The recent price increase is supported by higher trading volumes, indicating strong buying interest. This volume surge can be seen as a bullish signal, suggesting that the breakout above the consolidation phase might sustain.
Technical Indicators:
- Relative Strength Index (RSI):
- The RSI indicator is not shown on the provided chart, but it would be essential to check if the stock is approaching overbought levels (typically above 70) or oversold levels (below 30). Given the recent price surge, the RSI might be approaching overbought territory.
- Bollinger Bands:
- The stock’s price movement suggests it might be trading near the upper Bollinger Band, indicating potential overbought conditions and a possibility of a short-term pullback.
Outlook and Strategy:
- Bullish Scenario: If TUP can break above the $2.50 resistance level with strong volume, the next target would be around $3.50. Traders might consider entering a position on a breakout above $2.50, with a stop loss set just below the breakout level to manage risk.
- Bearish Scenario: If the stock fails to break above the $2.50 resistance and shows signs of reversal, it might retest the $2.00 support level or even fall back to the $1.50 support level. Traders should watch for a decline in volume on the down days as a sign of weakening selling pressure.
Conclusion: Tupperware Brands Corporation (TUP) is showing promising signs of a bullish breakout from its consolidation phase, supported by strong volume. Traders should watch key resistance levels and moving averages for further confirmation of the trend. As always, it is crucial to manage risk with appropriate stop-loss levels and position sizing.

Crown Electrokinetics Corp. (NASDAQ: CRKN) Secures Major Dark Fiber Construction Project, Trades Over 300 Million Shares

MGO Global Inc. (NASDAQ: MGOL) Surges 446% on Strong First Quarter Earnings

Greenwave Technology Solutions (NASDAQ: GWAV) Plummets 62% After Announcing Share Offering

Technical Analysis of Tupperware Brands Corporation (TUP)
RESEARCH: 2 High Growth Stocks Nearing Technical Breakouts

The Most Shorted Stocks as of Late March 2024

Mortgage Rates Hit 7.1%: Analyzing the Impact on the U.S. Housing Market

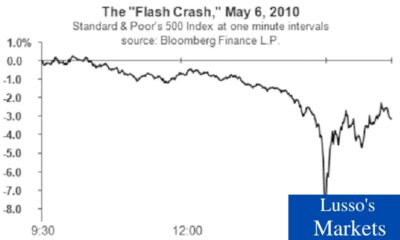
Understanding a Flash Crash in the Stock Market

A Glimpse Into the Buzz of Upcoming IPOs in April 2024

Potential Ban on TikTok: A Boon for Snapchat and Meta?

WiSA Technologies Shares Surge After Strategic Licensing Agreement and Reverse Split

YUUUUGE, $DJT TMTG Launches Live TV Streaming Platform via Truth Social

Netflix (NFLX) Trading Back Above The 50 Day Moving Average
Exclusive: Is The Stock Market Going To Crash…Soon?

Ocugen (OCGN) Trades Over 700Million Shares , Finishes The Day +200%

3 Trading Tips That Have Changed Traders Lives

Sorrento Therapeutics (SRNE) Receives FDA Clearance

Consumer Price Index, Jobless Claims; What To Know For Tomorrow

These Stocks Under $3 Traded Massive Volume Today

Is NIO the Hottest Stock On Wall Street ?

Cathie Wood Buys More Shares of Palantir Technologies (PLTR)

Sundial Growers (SNDL) Trades Massive Volume, What You Should Know…

Is The Stock Market In A “Bubble” ?

This Stock Under $10 Has Wall Streets Full Attention
-

 Markets3 months ago
The AI Revolution: How Super Micro Computer (SMCI) Skyrocketed in the Tech Rally
-

 Trading3 months ago
3 Must-Watch AI Stocks in 2024: Unveiling ShiftPixy, C3.ai, and CXApp’s Market Potential
-
 Lusso's Exclusives3 months ago
Wall Street Veteran Owns A Crap Ton Of Monday.com Stock [NASDAQ:MNDY]
-

 Markets3 months ago
Plus500 Ltd’s Financial Overview: A Glimpse into 2023’s Performance
-

 Markets1 month ago
Boeing’s Proactive Measures Ahead of Whistleblower Hearing
-
 Markets2 months ago
[BREAKING NEWS] ShiftPixy (PIXY): Poised for Explosive Growth with Strategic Acquisitions and $100 Million Financing
-
 Markets1 month ago
UnitedHealth Group Demonstrates Resilience in Q1 2024 Financial Report
-

 Markets1 month ago
Globe Life Inc. Issues Statement Refuting Short Seller Allegations
-
 Markets1 month ago
Understanding a Flash Crash in the Stock Market
-

 Markets2 months ago
Fisker Inc.’s Abrupt End to Automaker Talks Sparks Industry Speculation
-
 Markets2 months ago
The Impact of Aehr Test Systems’ Struggles on the Electric Vehicle Market