Markets
When Does Peloton (PTON) Report Q4 Earnings ?

UPDATE: August 4th, 2020
Peloton Interactive, Inc [ NASDAQ: PTON ] announced today they will release their fourth quarter and annual results for fiscal 2020 after 4pm Est on Thursday, September 10,2020.
PTON will be hosting their conference call at 5:00PM that day to go over the results.
Peloton Interactive Inc [ NASDAQ: PTON ] has been trading over 300% higher from March lows.

Pelaton Stock Daily Chart
As Peloton has yet to announce their Earnings release date for their Q4 Earnings we were told by Peter Stabler of Peloton that the Earnings date is ” Not yet announced”.
“We will issue a press release regarding the announcement date at least three weeks prior to the event.”
Stabler also told us, “As June 30 was the close of our fiscal year and Peloton is not yet designated a large, accelerated filer, we will be reporting late in the cycle.”
You can find more info on Pelatons investors section of their website.


DO NOT MISS THIS FREE OPPORTUNITY!
ARE YOU A TRADER?
DO YOU WANT FREE STOCK PICKS?
CHECK THIS OUT….
Ready to elevate your trading game with the next big winner? Don’t miss out – join the savvy investors who are already benefiting from our Wall St veteran’s free SMS alerts. Act now! Sign up at https://slktxt.io/ZmRx or send ‘FREE’ to 844-722-9743 and be the first to get the insider scoop on what’s hot in the market
Greenwave Technology Solutions (NASDAQ: GWAV), a company specializing in metal recycling, saw its stock price plummet by 62% on Tuesday following the announcement of a significant share offering. This steep decline reflects investor concerns over the dilution of existing shares and the potential impact on the company’s future.

Details of the Offering: Greenwave Technology Solutions is issuing 420,596,154 shares at $0.052 each to institutional and accredited investors, aiming to raise $21.87 million in gross proceeds. Additionally, the offering includes warrants to purchase an equal number of shares at an exercise price of $0.10 each.
Impact on GWAV Stock: The offering price of $0.052 per share is significantly below the previous closing price of $0.16, which has alarmed investors and led to a massive sell-off. The dilution effect and the discounted pricing have significantly impacted the stock’s value, contributing to the 62% drop observed at market close.
Key Concerns:
- Dilution of Shares:
- The new share issuance greatly dilutes the holdings of existing shareholders, reducing the value of their stakes in the company.
- Discounted Offering Price:
- The offering price of $0.052 per share is considerably lower than the previous close, which has raised questions about the company’s valuation and financial health.
- Potential Delisting:
- GWAV stock is also facing the threat of delisting, as the company needs to adjust its share price to meet listing requirements. This adds another layer of uncertainty for investors.
Market Reaction: The announcement led to a drastic drop in GWAV’s stock price, with a decrease of 60.4% by Tuesday morning and a total drop of 62% by the end of the trading day. Year-to-date, the stock has declined by 73.7%, highlighting the ongoing struggles and challenges faced by the company.
What This Means for Investors: The substantial drop in share price due to the offering has significantly eroded investor confidence. The dilution and the potential for further financial challenges cast a shadow over Greenwave Technology Solutions’ future prospects. Investors need to consider the risks associated with the dilution and the ongoing threat of delisting.
Outlook and Strategy:
- Bearish Scenario: Given the significant dilution and the discounted offering price, the bearish outlook dominates. Investors should remain cautious and watch for any further announcements from the company that might impact the stock’s performance.
- Bullish Scenario: For any bullish sentiment to return, Greenwave Technology Solutions will need to demonstrate a clear path to recovery, potentially through successful utilization of the raised capital and meeting listing requirements to avoid delisting.
Conclusion: Greenwave Technology Solutions (NASDAQ: GWAV) faces a challenging road ahead after the significant share offering and the resultant stock price decline. Investors should stay informed about the company’s strategic moves and financial health before making any investment decisions. As always, managing risk with appropriate stop-loss levels and careful position sizing is essential in such volatile conditions.

DO NOT MISS THIS FREE OPPORTUNITY!
ARE YOU A TRADER?
DO YOU WANT FREE STOCK PICKS?
CHECK THIS OUT….
Ready to elevate your trading game with the next big winner? Don’t miss out – join the savvy investors who are already benefiting from our Wall St veteran’s free SMS alerts. Act now! Sign up at https://slktxt.io/ZmRx or send ‘FREE’ to 844-722-9743 and be the first to get the insider scoop on what’s hot in the market
Tupperware Brands Corporation (TUP) is a consumer cyclical company in the packaging and containers sector. As of May 21, 2024, the stock is trading at $2.08, showing a positive change of $0.08 (+4.00%).

Chart Analysis:
- Price Trend and Volume:
- The stock experienced a significant downtrend from August 2023, with a steep decline in price accompanied by high trading volumes.
- A period of consolidation is observed from November 2023 to April 2024, where the stock traded mostly sideways between $1.00 and $2.00.
- Recently, there has been a breakout from this consolidation phase, with the price rising sharply in May 2024, accompanied by increased trading volumes.
- Support and Resistance Levels:
- Support Level: The key support level can be identified around $1.00, where the stock found a base during its consolidation phase.
- Resistance Levels: The stock faces immediate resistance around $2.50, a level that it approached but failed to breach in recent trading sessions. Another resistance level is observed around $3.50, marking a previous peak in September 2023.
- Moving Averages:
- SMA 10 (Short-term): The stock is currently trading above its 10-day simple moving average (SMA), indicating short-term bullish momentum.
- SMA 50 (Intermediate-term): The stock is also trading above the 50-day SMA, reinforcing the bullish trend.
- SMA 200 (Long-term): The stock is approaching its 200-day SMA, which could act as a significant resistance level. A break above this level could signal a longer-term trend reversal.
- Volume Analysis:
- The recent price increase is supported by higher trading volumes, indicating strong buying interest. This volume surge can be seen as a bullish signal, suggesting that the breakout above the consolidation phase might sustain.
Technical Indicators:
- Relative Strength Index (RSI):
- The RSI indicator is not shown on the provided chart, but it would be essential to check if the stock is approaching overbought levels (typically above 70) or oversold levels (below 30). Given the recent price surge, the RSI might be approaching overbought territory.
- Bollinger Bands:
- The stock’s price movement suggests it might be trading near the upper Bollinger Band, indicating potential overbought conditions and a possibility of a short-term pullback.
Outlook and Strategy:
- Bullish Scenario: If TUP can break above the $2.50 resistance level with strong volume, the next target would be around $3.50. Traders might consider entering a position on a breakout above $2.50, with a stop loss set just below the breakout level to manage risk.
- Bearish Scenario: If the stock fails to break above the $2.50 resistance and shows signs of reversal, it might retest the $2.00 support level or even fall back to the $1.50 support level. Traders should watch for a decline in volume on the down days as a sign of weakening selling pressure.
Conclusion: Tupperware Brands Corporation (TUP) is showing promising signs of a bullish breakout from its consolidation phase, supported by strong volume. Traders should watch key resistance levels and moving averages for further confirmation of the trend. As always, it is crucial to manage risk with appropriate stop-loss levels and position sizing.

DO NOT MISS THIS FREE OPPORTUNITY!
ARE YOU A TRADER?
DO YOU WANT FREE STOCK PICKS?
CHECK THIS OUT….
Ready to elevate your trading game with the next big winner? Don’t miss out – join the savvy investors who are already benefiting from our Wall St veteran’s free SMS alerts. Act now! Sign up at https://slktxt.io/ZmRx or send ‘FREE’ to 844-722-9743 and be the first to get the insider scoop on what’s hot in the market
Short selling is a strategy used by investors who believe that a stock’s price will decline, allowing them to buy it back at a lower price in the future. Market participants closely watch the most shorted stocks as they can be indicative of market sentiment or potential volatility. Based on the latest data from MarketWatch, here are the stocks with the highest short interest as of March 28, 2024.
1. IMAC Holdings Inc. (NASDAQ: BACK)
- Price: $3.30
- 1-Day Change: +6.80%
- Year-To-Date Change: +49.32%
- Short Interest: 880,148 shares
- Percent of Float Shorted: 93.92%
IMAC Holdings stands out with a massive 93.92% of its float being shorted, indicating significant bearish sentiment despite a strong year-to-date performance.
2. XTI Aerospace Inc. (OTC: XTIA)
- Price: $2.86
- 1-Day Change: +5.15%
- Year-To-Date Change: -49.11%
- Short Interest: 381,503 shares
- Percent of Float Shorted: 78.91%
XTI Aerospace has seen nearly 79% of its float shorted amidst a substantial decline in its stock price this year.
3. SunPower Corp. (NASDAQ: SPWR)
- Price: $1.96
- 1-Day Change: -8.41%
- Year-To-Date Change: -59.42%
- Short Interest: 39,254,967 shares
- Percent of Float Shorted: 76.64%
SunPower, a solar energy company, faces skepticism with over three-quarters of its float shorted following a sharp drop in its stock price.
4. BYND Cannasoft Enterprises Inc. (NASDAQ: BCAN)
- Price: $0.97
- 1-Day Change: +6.61%
- Year-To-Date Change: -98.50%
- Short Interest: 410,370 shares
- Percent of Float Shorted: 75.67%
BYND Cannasoft has witnessed an extreme decline in its price this year, coupled with a high short interest.
5. B. Riley Financial Inc. (NASDAQ: RILY)
- Price: $21.72
- 1-Day Change: +0.84%
- Year-To-Date Change: +3.48%
- Short Interest: 12,260,125 shares
- Percent of Float Shorted: 75.47%
B. Riley Financial appears more resilient, showing a positive year-to-date return, yet it still faces significant short pressure.
Other Notable Mentions:
- Biomea Fusion Inc. (NASDAQ: BMEA), Arbor Realty Trust Inc. (NYSE: ABR), and MicroCloud Hologram Inc. (NASDAQ: HOLO) also feature in the top 10 most shorted stocks, with short interests ranging from 41% to 48%.
Analysis:
Investors short sell stocks for various reasons, including speculation on price declines or hedging against potential downturns. The companies listed above are experiencing significant short interest, which could lead to price volatility, particularly if there is a sudden positive shift in their fundamentals, possibly leading to a short squeeze.
It’s essential for investors to conduct thorough research and consider multiple factors when investing in or short selling stocks, especially those with high short interest, as they can be particularly volatile.

Greenwave Technology Solutions (NASDAQ: GWAV) Plummets 62% After Announcing Share Offering

Technical Analysis of Tupperware Brands Corporation (TUP)
RESEARCH: 2 High Growth Stocks Nearing Technical Breakouts

The Most Shorted Stocks as of Late March 2024

Mortgage Rates Hit 7.1%: Analyzing the Impact on the U.S. Housing Market

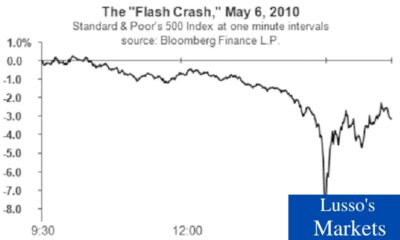
Understanding a Flash Crash in the Stock Market

A Glimpse Into the Buzz of Upcoming IPOs in April 2024

Potential Ban on TikTok: A Boon for Snapchat and Meta?

WiSA Technologies Shares Surge After Strategic Licensing Agreement and Reverse Split

YUUUUGE, $DJT TMTG Launches Live TV Streaming Platform via Truth Social

UnitedHealth Group Demonstrates Resilience in Q1 2024 Financial Report

Boeing’s Proactive Measures Ahead of Whistleblower Hearing

Netflix (NFLX) Trading Back Above The 50 Day Moving Average
Exclusive: Is The Stock Market Going To Crash…Soon?

Ocugen (OCGN) Trades Over 700Million Shares , Finishes The Day +200%

3 Trading Tips That Have Changed Traders Lives

Sorrento Therapeutics (SRNE) Receives FDA Clearance

Consumer Price Index, Jobless Claims; What To Know For Tomorrow

These Stocks Under $3 Traded Massive Volume Today

Is NIO the Hottest Stock On Wall Street ?

Cathie Wood Buys More Shares of Palantir Technologies (PLTR)

Sundial Growers (SNDL) Trades Massive Volume, What You Should Know…

Is The Stock Market In A “Bubble” ?

This Stock Under $10 Has Wall Streets Full Attention
-

 Markets3 months ago
The AI Revolution: How Super Micro Computer (SMCI) Skyrocketed in the Tech Rally
-

 Trading3 months ago
3 Must-Watch AI Stocks in 2024: Unveiling ShiftPixy, C3.ai, and CXApp’s Market Potential
-
 Lusso's Exclusives3 months ago
Wall Street Veteran Owns A Crap Ton Of Monday.com Stock [NASDAQ:MNDY]
-

 Business3 months ago
Deciphering HSBC Holdings plc’s Fiscal Landscape: An In-depth Analysis of 2023’s Outcomes
-

 Markets3 months ago
Plus500 Ltd’s Financial Overview: A Glimpse into 2023’s Performance
-
 Markets1 month ago
Boeing’s Proactive Measures Ahead of Whistleblower Hearing
-
 Markets2 months ago
[BREAKING NEWS] ShiftPixy (PIXY): Poised for Explosive Growth with Strategic Acquisitions and $100 Million Financing
-
 Markets1 month ago
UnitedHealth Group Demonstrates Resilience in Q1 2024 Financial Report
-

 Markets1 month ago
Globe Life Inc. Issues Statement Refuting Short Seller Allegations
-
 Markets1 month ago
Understanding a Flash Crash in the Stock Market
-

 Markets2 months ago
Fisker Inc.’s Abrupt End to Automaker Talks Sparks Industry Speculation