Markets
Stocks to Watch: AMD, ETSY, VIPS

The Stock Market has been soaring as of late with an aggressive FED. As we discuss three stocks to watch in this article we want to first start by listing our disclaimer: All information in this article is opinion only and not should be taken as buy or sell advice on any security. Our full disclaimer can be found here.
Thanks to our friends at Trend Spider as they are offering a free 7 day trial to test out there service which you can find by clicking on any of the Chart links in this article.
Not a Powerhouse Report Subscriber? It’s Free. Visit StockChartBreakouts.com to get on the list.
ADVANCED MICRO DEVICES [NASDAQ:AMD]

If you want to open this chart in another tab so you can see the chart and read the article at the same time, you can do so by clicking this link https://chrt.biz/AMD/18865cmevj7/chart/
Since the end of July AMD has traded range bound ( sideways channel) after it made a explosive move with little pullback. The Dow theory states their is 3 phases:
1.Accumulation Phase
2. Trend Phase
3. Distribution
With this being said we look at the current chart above and see that AMD’s sideways trading could be potentially the “Accumulation phase” if it does indeed breakout that is.
 Famous investor William J O’Neil used to buy stocks that were coming out of a sound base. Based on looking at the chart on the left you can almost say that AMD has put in a base as it has traded in a sideways channel between around $74 and $94.
Now, it is not trading as tight as you would like to see in my opinion but, last week was a tight ranged week as it held its gains above $90.
Traders on Wall Street will be looking at around $94 as a potential key number for the upcoming week.
Earnings Notes on AMD
AMD reported over 50% Increase in revenue. As a matter of fact they reported the highest increase in a quarter in their revenue, as they reported a 56% increase to 2.8 billion in revenue year over year.
“Our business accelerated in the third quarter resulting in record quarterly revenue with net income and EPS more than doubling year over year.” AMD CEO, Lisa Su
As they set a revenue record for the quarter, they also set a record for quarterly client processor revenue. Lisa Su was very impressed with the financials on the earnings conference call, she also expressed great optimism in the mobile category. In mobile they were able to “set records for both quarterly notebook processor unit shipments and revenue as OEM sell-through doubled year over year” Su stated.
With more people working from home and more demand to upgrade the home working environment you can say AMD was a beneficiary of the Social Distancing.
They made history: “We have the strongest notebook processor portfolio in our history” Su stated.
With the next gen gaming consoles coming out for Playstation and Xbox, AMD expects the fourth quarter to see an increase in semi custom shipments and revenue. They were able to set a record for the quarter for server processor revenue with them seeing sales grow double digit percentage.
After a great quarter for AMD the CFO stated that “we now expect higher year-over-year revenue growth”
 Besides the earnings, looking at the paper statistics and expectations we can see some, in my opinion, encouraging things.
First, since 2015 the company has seen rapid growth annually on their EPS (Earnings Per Share). This year they are estimated a 92% increase and in 2021, they are estimated a 46% increase which still shows them growing at a rapid pace.
 Second, you can see that the big money has kept increasing as the Number of Funds holding positions have gone up 4 quarters in a row.
To put things short, AMD has seen triple digit % growth 4 quarters in a row. They are seeing the “big money” continue to come into the stock and their annual EPS is showing great expectations.
Now, to sum things up, AMD does trade heavy with the overall Market and if the S&P 500 does take a hit to the downside then AMD could very well sell off as well. As this information is only information and not advice by any means, in my opinion AMD hasn’t peaked yet and this $94 area will be a key area to watch.
ETSY INC. [NASDAQ:ETSY]

If you want to open this chart in another tab so you can see the chart and read the article at the same time, you can do so by clicking this link https://chrt.biz/ETSY/18865daubdx/chart/
Looking at the chart above you can see the illustration using peak to trough analysis that ETSY is currently near the top of the ascending channel . Last week ETSY had multiple days with low volume which could be a sign of potential low supply.
If their was big volume we could suspect selling as people looked to take profits but the lack of volume says otherwise. The lack of volume could be a sign of a lack of sellers and with that being said, if that is the case, it would only take a little bit of a increased in demand to make a next leg up potentially.
What to watch:
- It will be worth watch the 10 day moving average as it is approaching the price level which could act as support
- $150 area. If it test this area it will be worth watching if buying comes in on high volume or if it does sell below $150 will it sell on high volume?

ETSY is part of the Retail-Internet industry group and while it has been one of the strongest industry groups out there this year, the entire industry group as a whole has been consolidating. Referring to the chart above.
Will the Holiday shopping be a catalyst for this industry group and ETSY to gain momentum?
Earnings Notes
ETSY surpassed earnings estimates and did so with a very appealing earnings release.
 ETSY was able to report both triple digit % growth in Sales and EPS the last 2 quarters. The most recent triple digit % growth quarter was great confirmation for anyone who was skeptical on the prior quarters report.
 Not only are the numbers convincing in my opinion but the big money was buying last quarter as it shows the big jump in Number of funds from 783 to 1025.
A few concerns is even though 2020 is expected to grow 180% in the annual EPS column, they are only expected to grow 2% in the annual EPS column on Marketsmith.
Vipshop Holdings Ltd Ads [ NYSE: VIPS ]

If you want to open this chart in another tab so you can see the chart and read the article at the same time, you can do so by clicking this link https://chrt.biz/VIPS/18865dcqym4/chart/
VIPS has been very strong since October with the stock riding the 10 day moving average (blue line in the chart).
Famous Traders such as Jesse Livermore always preached about trading along the line of least resistance and since October the line of least resistance has been up.
Technically the MACD which is a momentum indicator has bearishly converged as VIPS has retraced from the highs.
Why is VIPS on this article? Well simple. We are watching if this stock is a tennis ball or a egg. In other words does it bounce back to the highs quickly ? If it does, that is a potential sign of accumulation.
Earnings Notes
VIPS in my opinion has not reached their high growth phase yet and as they have more cash on hand, I would like to see them invest the cash into the company to expand it and grow it. When a company can invest in themselves it will potentially allow the company to grow and this could cause demand to come into the stock based on the future of the company.
This stock is in a strong industry group, the retail-internet industry group and in my opinion, I do not anticipate any super nova moves yet on this stock but, this could be a slow grinder to the upside potentially.
The company is located in China and might have to agree to a more stricter audit in the future given the US gov. passes a new bill aimed at China companies listed on the US stock market.
To sum this company up, they are growing at a steady rate each quarter and nearing new all time highs. If it can hold the 10 day moving average then it could potentially see demand come into this pushing it up further.


DO NOT MISS THIS FREE OPPORTUNITY!
ARE YOU A TRADER?
DO YOU WANT FREE STOCK PICKS?
CHECK THIS OUT….
Ready to elevate your trading game with the next big winner? Don’t miss out – join the savvy investors who are already benefiting from our Wall St veteran’s free SMS alerts. Act now! Sign up at https://slktxt.io/ZmRx or send ‘FREE’ to 844-722-9743 and be the first to get the insider scoop on what’s hot in the market
Short selling is a strategy used by investors who believe that a stock’s price will decline, allowing them to buy it back at a lower price in the future. Market participants closely watch the most shorted stocks as they can be indicative of market sentiment or potential volatility. Based on the latest data from MarketWatch, here are the stocks with the highest short interest as of March 28, 2024.
1. IMAC Holdings Inc. (NASDAQ: BACK)
- Price: $3.30
- 1-Day Change: +6.80%
- Year-To-Date Change: +49.32%
- Short Interest: 880,148 shares
- Percent of Float Shorted: 93.92%
IMAC Holdings stands out with a massive 93.92% of its float being shorted, indicating significant bearish sentiment despite a strong year-to-date performance.
2. XTI Aerospace Inc. (OTC: XTIA)
- Price: $2.86
- 1-Day Change: +5.15%
- Year-To-Date Change: -49.11%
- Short Interest: 381,503 shares
- Percent of Float Shorted: 78.91%
XTI Aerospace has seen nearly 79% of its float shorted amidst a substantial decline in its stock price this year.
3. SunPower Corp. (NASDAQ: SPWR)
- Price: $1.96
- 1-Day Change: -8.41%
- Year-To-Date Change: -59.42%
- Short Interest: 39,254,967 shares
- Percent of Float Shorted: 76.64%
SunPower, a solar energy company, faces skepticism with over three-quarters of its float shorted following a sharp drop in its stock price.
4. BYND Cannasoft Enterprises Inc. (NASDAQ: BCAN)
- Price: $0.97
- 1-Day Change: +6.61%
- Year-To-Date Change: -98.50%
- Short Interest: 410,370 shares
- Percent of Float Shorted: 75.67%
BYND Cannasoft has witnessed an extreme decline in its price this year, coupled with a high short interest.
5. B. Riley Financial Inc. (NASDAQ: RILY)
- Price: $21.72
- 1-Day Change: +0.84%
- Year-To-Date Change: +3.48%
- Short Interest: 12,260,125 shares
- Percent of Float Shorted: 75.47%
B. Riley Financial appears more resilient, showing a positive year-to-date return, yet it still faces significant short pressure.
Other Notable Mentions:
- Biomea Fusion Inc. (NASDAQ: BMEA), Arbor Realty Trust Inc. (NYSE: ABR), and MicroCloud Hologram Inc. (NASDAQ: HOLO) also feature in the top 10 most shorted stocks, with short interests ranging from 41% to 48%.
Analysis:
Investors short sell stocks for various reasons, including speculation on price declines or hedging against potential downturns. The companies listed above are experiencing significant short interest, which could lead to price volatility, particularly if there is a sudden positive shift in their fundamentals, possibly leading to a short squeeze.
It’s essential for investors to conduct thorough research and consider multiple factors when investing in or short selling stocks, especially those with high short interest, as they can be particularly volatile.
DO NOT MISS THIS FREE OPPORTUNITY!
ARE YOU A TRADER?
DO YOU WANT FREE STOCK PICKS?
CHECK THIS OUT….
Ready to elevate your trading game with the next big winner? Don’t miss out – join the savvy investors who are already benefiting from our Wall St veteran’s free SMS alerts. Act now! Sign up at https://slktxt.io/ZmRx or send ‘FREE’ to 844-722-9743 and be the first to get the insider scoop on what’s hot in the market
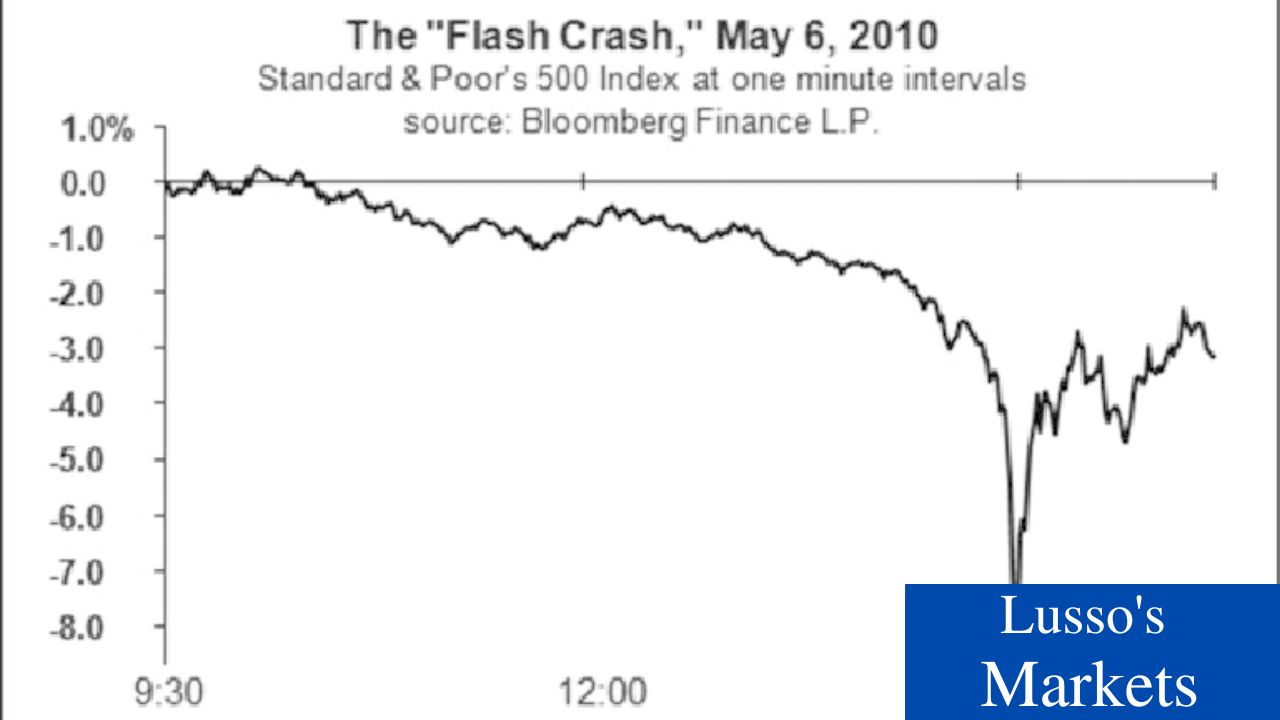
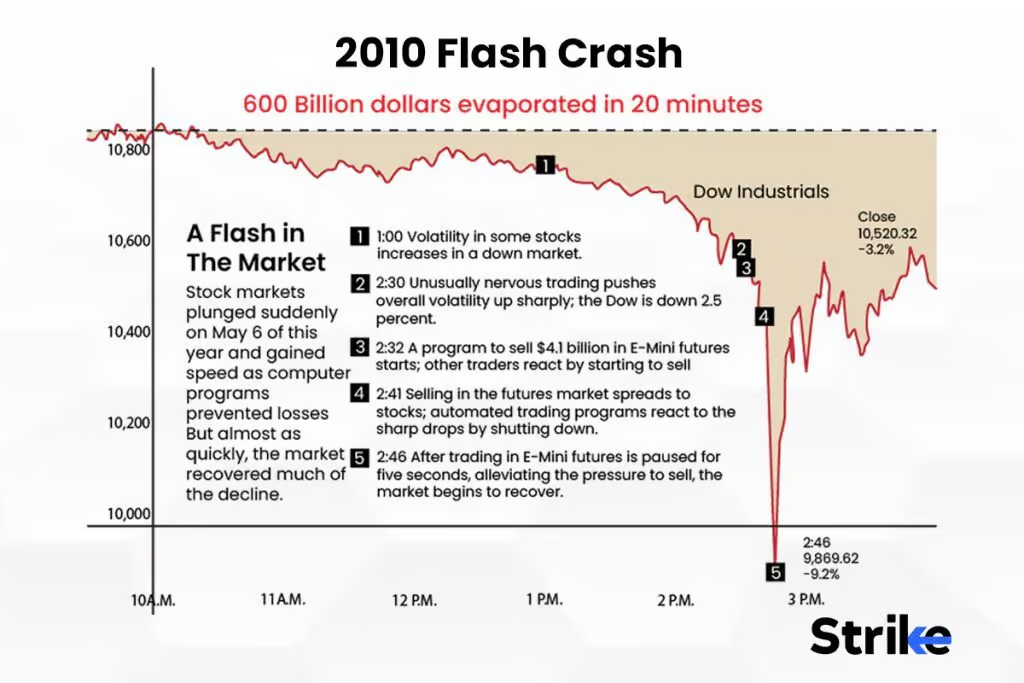
In the fast-paced world of finance, few events can instill as much immediate fear and confusion as a “flash crash.” This term describes an event where stock prices plummet sharply within an extremely short period—often just minutes—before often rebounding just as quickly. These rapid and dramatic movements can result in substantial market disruptions, affecting a wide range of assets including stocks, bonds, and commodities.
Origins of a Flash Crash
The concept of a flash crash became widely recognized after the most notorious example, which occurred on May 6, 2010. During this event, the Dow Jones Industrial Average fell about 1,000 points (over 9%) only to recover those losses within minutes. This sudden plunge and recovery highlighted inherent vulnerabilities in the market structures and systems.
Causes of Flash Crashes
Flash crashes can be triggered by a variety of factors, which often interact in complex ways:
- High-Frequency Trading (HFT): Many analysts attribute the rise of flash crashes to the increase in high-frequency trading, where firms use algorithms to execute millions of orders at lightning speed. These algorithms can sometimes create feedback loops if they start to sell off assets in a falling market, amplifying the initial decline.
- Market Structure Issues: The fragmentation of trading venues and the varying rules and technologies used by these platforms can also contribute to flash crashes. Disparities in trading rules and protocols can lead to situations where automated systems behave unpredictively or inefficiently.
- Liquidity Crunches: Flash crashes are often exacerbated by a sudden lack of liquidity. As prices begin to fall, automatic stop-loss orders can trigger further selling, but if there aren’t enough buyers, prices can drop precipitously.
- News and Social Media: Sometimes, an erroneous news report or a significant surge in social media activity can spur rapid trading actions by algorithms that parse news and data for trading signals.
Impact and Responses
The impact of a flash crash is broad. In the short term, investors can see huge losses, and confidence in the markets can wane. For traders, the volatility can result in significant financial damage, especially for those who are unable to react quickly enough to the abrupt price changes.
In response to flash crashes, regulatory bodies have implemented several measures to prevent or mitigate their effects. For example, after the 2010 crash, the U.S. Securities and Exchange Commission (SEC) introduced “circuit breakers” that temporarily halt trading in a stock if its price drops too quickly.
Preventative Measures
Beyond regulatory changes, there’s also a push for improved risk management strategies within trading firms, especially those employing high-frequency trading algorithms. These measures include more sophisticated and robust systems to monitor and control trading activities and improved testing of algorithms to ensure they behave as expected during market stress.
The Ever-Evolving Market Dynamics
As markets evolve and the use of technology deepens, the potential for flash crashes remains significant. This necessitates continuous advances in both technology and regulation to safeguard against the risks posed by these rapid and unpredictable market events.
Understanding flash crashes is crucial for anyone involved in the trading world, from regulators and traders to ordinary investors trying to navigate the complexities of modern financial markets. Recognizing the signs and potential triggers of flash crashes can help market participants better prepare for and potentially avoid the risks associated with these startling events.

DO NOT MISS THIS FREE OPPORTUNITY!
ARE YOU A TRADER?
DO YOU WANT FREE STOCK PICKS?
CHECK THIS OUT….
Ready to elevate your trading game with the next big winner? Don’t miss out – join the savvy investors who are already benefiting from our Wall St veteran’s free SMS alerts. Act now! Sign up at https://slktxt.io/ZmRx or send ‘FREE’ to 844-722-9743 and be the first to get the insider scoop on what’s hot in the market
The investment atmosphere is heating up with a series of intriguing initial public offerings (IPOs) set to hit the market in late April 2024. This month features a diverse lineup of companies poised to go public, ranging from technology innovators to international restaurant chains. Here’s a detailed look at some of the most anticipated IPOs.
Tungray Technologies Inc. (TRSG)
Exchange: NASDAQ Capital
Price: $4.00
Shares: 1,250,000
Expected IPO Date: 4/19/2024
Offer Amount: $5,000,000
Tungray Technologies is stepping into the public market with a modest offer amount. The company’s focus on innovative tech solutions might attract investors looking for new growth opportunities in the tech sector.
RanMarine Technology B.V. (RAN)
Exchange: NASDAQ Capital
Price: $5.50
Shares: 1,435,000
Expected IPO Date: 4/19/2024
Offer Amount: $9,076,375
RanMarine Technology, known for its advanced marine technology solutions, is also set for the same date. With a slightly higher offer amount, it shows potential for considerable market interest.
Sushi Ginza Onodera, Inc. (ONDR)
Exchange: NYSE MKT
Price Range: $7.00-$8.00
Shares: 1,066,667
Expected IPO Date: 4/19/2024
Offer Amount: $9,813,336.40
Offering a culinary twist to the IPO scene, Sushi Ginza Onodera is preparing to serve not just premium sushi but also potentially premium stock value.
mF International Ltd (MFI)
Exchange: NASDAQ Capital
Price Range: $4.00-$5.00
Shares: 1,560,000
Expected IPO Date: 4/22/2024
Offer Amount: $8,970,000
This global firm is entering the market with a flexible price range, suggesting a cautious yet optimistic approach towards investor reception.
YY Group Holding Ltd. (YYGH)
Exchange: NASDAQ Capital
Price Range: $4.00-$5.00
Shares: 1,500,000
Expected IPO Date: 4/22/2024
Offer Amount: $8,625,000
YY Group is another promising prospect with its roots in technology and digital transformation, aiming to capture the tech-savvy investor’s eye.
Key Mining Corp. (KMCM)
Exchange: NYSE MKT
Price: $2.25
Shares: 4,444,444
Expected IPO Date: 4/25/2024
Offer Amount: $11,499,999.80
Diving into natural resources, Key Mining is set for a significant offering, indicating robust investor confidence in its mining operations and commodity potential.
Marex Group plc (MRX)
Exchange: NASDAQ Global Select
Price Range: $18.00-$21.00
Shares: 15,384,615
Expected IPO Date: 4/25/2024
Offer Amount: $371,538,447
As one of the heaviest hitters this month, Marex Group plc commands attention with its substantial offer amount, reflecting its established market presence and investor trust.
Rubrik, Inc. (RBRK)
Exchange: NYSE
Price Range: $28.00-$31.00
Shares: 23,000,000
Expected IPO Date: 4/25/2024
Offer Amount: $819,950,000
Rubrik stands out with a massive offer, targeting tech investors interested in data management and cloud services, marking it as one of the blockbuster listings of the month.
Loar Holdings, LLC (LOAR)
Exchange: NYSE
Price Range: $24.00-$26.00
Shares: 11,000,000
Expected IPO Date: 4/26/2024
Offer Amount: $328,900,000
Loar Holdings is geared up to make a significant impact with its sizable offer, highlighting its robust positioning in the manufacturing sector.
ZenaTech, Inc. (ZENA)
Exchange: NASDAQ Capital
Expected IPO Date: 4/30/2024
Offer Amount: $7,100,900
Wrapping up the month, ZenaTech will test waters with a strategic focus on tech innovations, appealing to niche investors keen on cutting-edge technologies.
April 2024 is shaping up to be a dynamic month for the IPO market, showcasing a wide range of sectors and opportunities. Investors are advised to keep an eye on these dates and delve deeper into each company’s prospects before making investment decisions. Each of these companies presents unique opportunities and challenges, marking another exciting chapter in the financial markets.

RESEARCH: 2 High Growth Stocks Nearing Technical Breakouts

The Most Shorted Stocks as of Late March 2024

Mortgage Rates Hit 7.1%: Analyzing the Impact on the U.S. Housing Market

Understanding a Flash Crash in the Stock Market

A Glimpse Into the Buzz of Upcoming IPOs in April 2024

Potential Ban on TikTok: A Boon for Snapchat and Meta?

WiSA Technologies Shares Surge After Strategic Licensing Agreement and Reverse Split

YUUUUGE, $DJT TMTG Launches Live TV Streaming Platform via Truth Social

UnitedHealth Group Demonstrates Resilience in Q1 2024 Financial Report

Boeing’s Proactive Measures Ahead of Whistleblower Hearing

Bank Earnings Reflect Mixed Financial Fortunes as Major Institutions Report Quarterly Results

Globe Life Inc. Issues Statement Refuting Short Seller Allegations

Netflix (NFLX) Trading Back Above The 50 Day Moving Average
Exclusive: Is The Stock Market Going To Crash…Soon?

Ocugen (OCGN) Trades Over 700Million Shares , Finishes The Day +200%

3 Trading Tips That Have Changed Traders Lives

Sorrento Therapeutics (SRNE) Receives FDA Clearance

Consumer Price Index, Jobless Claims; What To Know For Tomorrow

These Stocks Under $3 Traded Massive Volume Today

Is NIO the Hottest Stock On Wall Street ?

Cathie Wood Buys More Shares of Palantir Technologies (PLTR)

Sundial Growers (SNDL) Trades Massive Volume, What You Should Know…

Is The Stock Market In A “Bubble” ?

This Stock Under $10 Has Wall Streets Full Attention
-

 Markets3 months ago
The AI Revolution: How Super Micro Computer (SMCI) Skyrocketed in the Tech Rally
-
 Lusso's Exclusives2 months ago
Wall Street Veteran Owns A Crap Ton Of Monday.com Stock [NASDAQ:MNDY]
-

 Markets3 months ago
Mastering the Market: A Guide to the Fundamentals of Value Investing
-

 Trading3 months ago
3 Must-Watch AI Stocks in 2024: Unveiling ShiftPixy, C3.ai, and CXApp’s Market Potential
-

 Business3 months ago
Deciphering HSBC Holdings plc’s Fiscal Landscape: An In-depth Analysis of 2023’s Outcomes
-

 Markets3 months ago
Plus500 Ltd’s Financial Overview: A Glimpse into 2023’s Performance
-
 Markets1 month ago
Boeing’s Proactive Measures Ahead of Whistleblower Hearing
-
 Markets2 months ago
[BREAKING NEWS] ShiftPixy (PIXY): Poised for Explosive Growth with Strategic Acquisitions and $100 Million Financing
-
Lusso's Exclusives3 months ago
Top Stocks to Watch Tomorrow: LQR, NVDA, SMCI, and HOLO
-
 Markets1 month ago
UnitedHealth Group Demonstrates Resilience in Q1 2024 Financial Report
-

 Markets2 months ago
Fisker Inc.’s Abrupt End to Automaker Talks Sparks Industry Speculation